
Process Twin: from sensor signal to approved work order
Process Twin is our demonstrator for predictive maintenance in the process industry: 32 simulated plants, NVIDIA models on a local GPU and people approving every action. Here is what it shows, what AI is good at when the data volumes get large, and how we deliver.
 Jon Gottfred AndersenChair of the Board and dermatologist
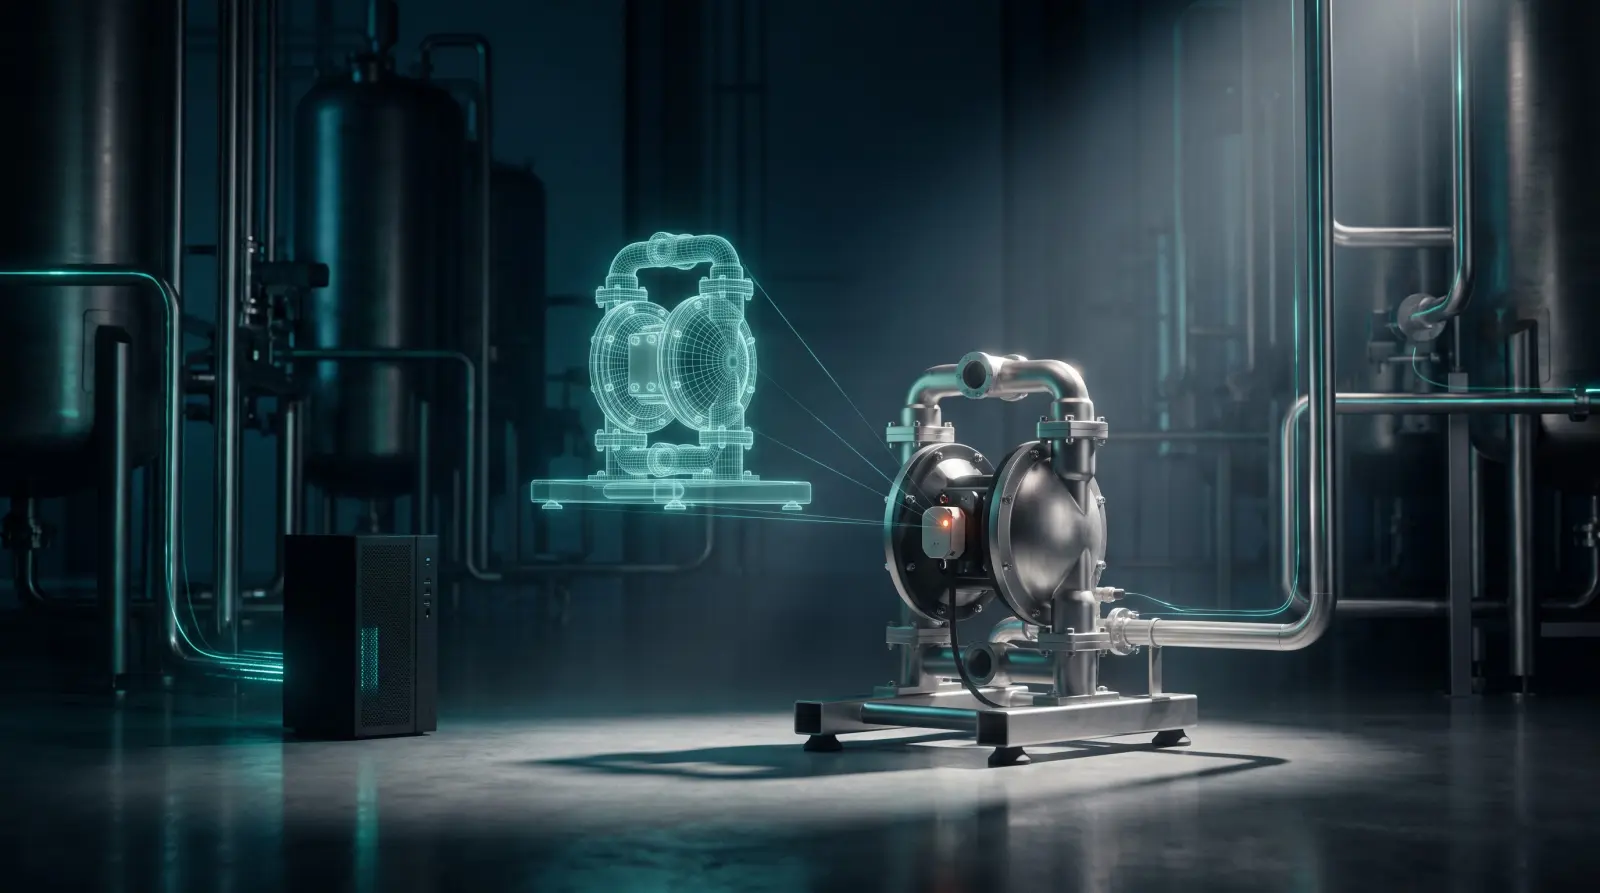
A pump diaphragm does not wear out overnight. The volume per stroke drops a little every week, the pump runs a little faster and uses a little more compressed air to deliver the same flow. None of the readings crosses an alarm limit until the diaphragm fails, and by then the line is down.
The signals that could have warned you usually exist already: in variable-frequency drives, PLCs, sensors and work-order history. What is missing is someone who reads thousands of signals at once, sees how they relate and turns the finding into a planned job. We built Process Twin to show how that works.
Process Twin is a working demonstrator, and you can test it yourself at pt.skjld.cloud. One thing first: all plant data in the demo is simulated, and the connections to ERP and purchasing are mocks. The method is the one we would run on your data. The numbers are not yours.
In brief
- Process Twin follows a deviation all the way: signal, AI alert, maintenance window, work order and parts, approval and feedback from the technician.
- Predictive maintenance moves the job from breakdown to planned stop. What that is worth is measured on the plant's own data before anyone talks about rollout.
- AI is strongest where people fall short: many signals at once, slow trends, comparison across plants and patterns in time.
- The demo runs locally on NVIDIA hardware, with NVIDIA's Kumo models for time series and a local language model that explains the findings.
- We deliver on site in the plant, locally from our own servers in Sandefjord, in the cloud and together with external partners and suppliers.
What is Process Twin?
Process Twin is a digital twin of operations and maintenance in the process industry. The demo simulates a fleet of 32 process plants running batch production: 87 lines, 1,445 modelled components and 5,148 signals. The plants differ in age and level of automation, from manual plants with legacy PLCs to fully automated plants with DCS, as a real fleet usually does.
Around 700 readings arrive every second, more than 60 million a day, and they are stored in a time-series database. On top of this sit the analyses: condition and estimated remaining life per component, alerts, work-order drafts, inventory and ordering, energy, OEE and quality, comparison between plants, what-if calculations and a big-screen view for the control room. The whole solution, including the AI models, runs on a single machine on our premises: a Dell Pro Max with NVIDIA GB10.
The idea is simple: signal, context, decision, action. An alert is worth little unless it ends as a job someone has approved, with the right parts in place at the right time.
One sequence: the diaphragm pump
The guided tour in the demo follows one diaphragm pump through six steps.
- Signal. Volume per stroke is flow divided by stroke rate. As the diaphragm wears, the volume per stroke drops. The pump has to run faster and use more compressed air to keep the same flow.
- AI alert. The alert comes with the failure risk for the next 30 days, the time to act with a specific deadline, and a confidence level. The confidence is built from model quality, signal strength and whether wear and life trend point the same way, and the reasoning is shown next to the number. When we wrote this, the demo showed 71 per cent risk, 21 days to the deadline and 77 per cent confidence for this pump.
- Maintenance window. The system proposes the hour with the lowest expected load on the line between “parts ready” and the deadline, and shows alternatives. The planner can choose another window.
- Work order and parts. AI drafts the work order. The parts are checked against the pump model, so variants that do not fit are rejected. The draft shows local stock, stock in the region with transfer time, and supplier lead time.
- Approval. The work order and the purchase are approved or rejected separately. Nothing moves on without a person.
- Execution and learning. The technician confirms whether the diagnosis was right, and what the cause actually was. The answer is stored on the event and can be used when the model is validated later.
The prediction is an estimate that has to be checked against actual condition. That is why approval and feedback are part of the sequence.
What you get from predictive maintenance
Maintenance is mostly run in three ways. Reactive maintenance waits until something fails. Preventive maintenance replaces parts by calendar or operating hours, whether they are worn or not. Predictive maintenance plans the job from the estimated condition and remaining life of each component.
The gains show up in several places:
- Fewer unplanned stops. The job is done in a window you choose, instead of in the middle of a batch.
- Shorter repairs. Once the fault has been flagged, the work order is written and the parts are reserved before the technician heads out.
- Parts on time, without an overfilled stockroom. Requirements are netted against stock and incoming supply, the order date is set from the lead time, and delays are flagged. That means fewer rush orders.
- The right service life for parts. Components are replaced when their condition calls for it. You avoid both replacing too early and running to failure.
- Less consequential damage. A component replaced in time does not get the chance to damage the equipment around it.
- Experience that stays. “The diaphragm fails roughly every six months, replace it in month five” is knowledge that often sits with one person. Here it becomes a rule that is followed up at every plant.
How much is it worth? The US Department of Energy's guide to operations and maintenance estimates that a well-functioning predictive programme saves 8 to 12 per cent compared with preventive maintenance alone, and that facilities relying heavily on reactive maintenance can save 30 to 40 per cent or more (DOE). The guide is from 2010, and the figures are general estimates. They say nothing about a specific plant.
That is why we start with a back-test. The analysis runs on the history first, and the alerts are compared with what actually happened. In the demo the method is shown on simulated data: the model is tuned on the first 60 of 120 days and tested on the next 60, against today's fixed alarm limits.
- Median lead time before failure was 13.0 days with the AI model and 2.8 days with fixed limits.
- The AI model warned of 356 of 769 downtime hours. The fixed limits warned of 190.
- The hit rate was 44 per cent against 40 per cent.
- The AI model gave more false alerts, meaning alerts followed neither by a failure within 45 days nor by a planned replacement: 261 against 96.
- The picture varies by equipment type. For electric motors the AI model caught 78 per cent of the failures, while the fixed limits caught none. For filters it was the other way round: the fixed limit caught 97 per cent, the AI model 57.
The point is that the trade-off becomes visible. The alarm level can be adjusted: a higher level gives fewer and more certain alerts, but shorter lead time. We want numbers like these on the table per machine type, from your own history, before anyone decides on rollout.
What AI is good at when the data volumes get large
A person can follow a handful of curves. A plant has thousands, and a fleet has many times that. Aker BP collects around one million time series, and only a small share of them is monitored, according to Cognite, which together with NVIDIA is deploying time-series models for anomaly detection at the company (Cognite). That is not our delivery, but it shows the order of magnitude. Here are the strengths AI has on data volumes like these, as shown in Process Twin.
Relationships between signals
A fixed limit looks at one signal. Wear on the diaphragm pump shows up first in the relationship between flow, stroke rate, air pressure and air consumption. NVIDIA's Kumo-Anomaly assesses such relationships over time, without anyone having labelled the data as “fault” and “normal” in advance.
Trends before the limit is reached
The demo has a separate view for components that are still below today's alarm limits, but where the trend already points to failure. Each of them has a diagnosis and a recommended check. That is the difference between a threshold on a screen and an analysis.
Comparison across plants
The same coupling, pump or motor is installed at many plants. When all of them are measured against the fleet's healthy level, deviations stand out, and experience from one plant can be used at the others. The demo works out which plants can learn from each other, and where a shared spare-parts stock and a shared maintenance model make sense.
Patterns in time
The simulation contains a hidden story: at one plant the filling machine stops more often at morning start-up. The analysis finds it. 22 of 42 stops came between 06:00 and 09:00, almost three times as many as expected, and the most common cause was viscosity and temperature in the filling head. The hypothesis is to preheat the filling head and standardise the start-up. Patterns like this drown in an ordinary alarm list.
Forecasts and what-if
Kumo-Forecast produces forecasts for the next hour for flow, bearing temperature and the plant's electricity demand. The what-if view calculates the effect of changes to maintenance interval, mixer speed and batch size, and of measures such as batch sequencing and shifted start-up, before anyone changes anything in the plant.
Explanations in plain language
A local language model has read access to the fleet data and answers questions such as “which plants should we look at first, and why?”. It also writes studies for management. There, numbers and tables are generated by code, and the text is checked against the underlying data before the report is saved.
And the limits
AI does not replace the mechanic.
An anomaly is a reason to investigate, not a confirmed fault, and a flag can just as well be caused by a perfectly normal batch transition. Pretrained models have to be calibrated on normal operation for each machine type. In our first run, the Kumo forecast did not beat a simple comparison that just repeats the last reading, and the demo says so openly. Results like that are the reason we measure before we promise anything.
Built on NVIDIA's models and tools
Skjld Labs is a member of NVIDIA Inception, NVIDIA's programme for companies building with AI. We deliver projects on NVIDIA's models, libraries and hardware, and Process Twin shows how the parts fit together. This is what runs in the demo today:
- NVIDIA GB10. The demo runs on a Dell Pro Max with GB10, a small machine with NVIDIA's Grace Blackwell chip and 128 GB of memory. It handles data collection, analyses, time-series models and the language model at the same time.
- NVIDIA Kumo. Kumo is NVIDIA's family of open models, libraries and tools for prediction on tables and time series. We use Kumo-Anomaly for anomaly detection and Kumo-Forecast for forecasts, on three industrial cases: a diaphragm pump, a mixer motor with bearings and the plant's electricity demand. The models run on the GPU in the machine, and no measurement data is sent to NVIDIA or anyone else.
- NVIDIA SimReady. The 3D workcell in the demo is built from seven of NVIDIA's SimReady models in OpenUSD, converted for display in the browser. They include a pump, a pressure pot, an IBC container and a conveyor. The cell shows how equipment can get a place and an identity even when the plant has no CAD model.
- Local language model. The assistant and the studies use an open language model that runs on the same GPU.
In a customer project we bring in more tools from the same toolbox when the need is there. These are proposed as next steps in Process Twin and have to be validated in a pilot:
- Omniverse and OpenUSD for a full 3D twin where live readings are bound to each component.
- NIM microservices and NeMo Retriever for language models and search across procedures, maintenance history and laboratory reports, with NeMo Guardrails as safeguards.
- RAPIDS cuDF and cuML when thousands of signals and several years of history are to be analysed on the GPU.
- Metropolis for camera-based inspection at filling and packaging.
- Isaac Sim for simulating internal logistics before investing.
- cuOpt for production planning as an optimisation problem.
In production we replace the development machine with industrial-grade hardware, for example NVIDIA IGX Thor, Jetson or a certified server. IGX is built for industrial environments and comes with up to ten years of support (NVIDIA).
Four ways to deliver
Where the solution should run is decided by your data, your network and your requirements. We deliver in four ways, often in combination.
On site: in the plant
One NVIDIA unit per plant sits behind the firewall between OT and IT. Sensor data is read through an approved gateway using OPC UA or MQTT, and the models run where the data originates. Only results leave the plant, for example aggregated KPIs and work-order drafts. The connection to the control systems is read-only. The twin recommends, and it never changes setpoints in a PLC or DCS.
Locally: on our own servers in Sandefjord
By default, the solutions we build run on our own servers in Sandefjord, on NVIDIA hardware. That suits back-tests on history, studies and a shared fleet view when the data may leave the plant but has to stay in Norway. Skjld Cloud, our workspace for teams and AI agents, also runs on our own servers in Norway.
Cloud: when you have already chosen a platform
If you already have a cloud platform, or need capacity for training and simulation across many plants, the analysis layer can run there. We are a Microsoft Solutions Partner and a Google Cloud Partner.
Together with external partners and suppliers
A maintenance project involves more people than us. We work with those you already use: the automation supplier who knows the PLCs, the ERP partner who owns the work orders, and the IT and security teams who have to approve the data flow. Where it fits best, an external partner or supplier takes on parts of the delivery, such as hardware, network or operations. As a member of NVIDIA Inception, we have access to NVIDIA's technology, training and experts when a project needs it.
Whatever the model, the same rules apply: read access as the starting point, least privilege, approval by a named person for everything that is written back, and a log of who approved what.
Fits the systems you already have
A twin only becomes useful when it talks to the rest of the business. Process Twin is designed for three kinds of connections:
- The building model (IFC/BIM). The model gives every machine a place and a permanent ID. The pump in the drawing, the sensor on the pump and the pump in the ERP system become one and the same.
- ERP and maintenance system. The twin reads stock and equipment history and drafts the work order and the parts request. A person approves before anything is sent.
- CRM. When a line needs maintenance, the twin shows which customer orders depend on it, so the stop can be planned or the customer warned in time.
In the demo, the ERP connection is a mock, the IFC connection is an illustrated example and CRM is not connected. In a delivery, the connections are set up and validated for each customer, first against copies and test environments.
From demo to pilot
We recommend starting narrow: one plant, one machine family and one failure type. We begin with the failure mechanism, together with our mechanical engineer and your maintenance people, and choose signals afterwards.
- Technical review. Equipment list, work-order history and signal list. Together we choose the plant, the machine family and the failure type.
- Back-test and a unit in the plant. The analysis runs on the history first. In parallel, one NVIDIA unit is installed behind the OT gateway, reviewed by IT, OT and security.
- Live period and result sheet. Alerts, technician findings and work orders are logged on the same machines. You get a before-and-after sheet with your own numbers and a rollout plan ordered by how mature the data is at each plant.
No benefit is claimed before it is measured.
If the data cannot support a remaining-life forecast, you get a condition analysis and a data-collection plan instead, and we say so plainly.
To get started we need four things: an equipment list, work-order history from the ERP system, a signal list and a contact person for IT and OT.
What the demo is not
Process Twin is a demonstrator. The plant data is simulated, and ERP, work orders and purchasing are mocks. No real orders are sent, and no machines are controlled. The 3D scene is an illustration, not an Omniverse twin. The benefit figures in the demo are calculated from the simulation and stated assumptions to show the method. Predictions have to be validated on real data, and people approve work orders and purchases.
Test it yourself
The demo is open at pt.skjld.cloud. Start with the pump scenario and follow the ten steps, or go straight to what matters most to you.
Would you like to see what this means for your own machines? Book a free thirty-minute call, or read more about local and Norwegian AI.
Read also
- Local predictive analytics: how SMEs can leverage AI without cloud dependency and high licensing costs
- Local AI and data sovereignty: How Norwegian businesses master the new AI models
- Where does your data end up when you use AI?
Sources
- Skjld Labs: Process Twin, demonstrator with simulated data. The figures from the demo were read on 17 November 2026.
- NVIDIA: Kumo overview and Kumo-TS on GitHub
- NVIDIA: SimReady assets
- NVIDIA: IGX
- Dell: Dell Pro Max with GB10
- U.S. Department of Energy, FEMP: Operations & Maintenance Best Practices, Release 3.0, August 2010, chapter 5
- Cognite: press release on NV-Tesseract at Aker BP, 23 March 2026
- The main image is an AI-generated illustration, not a photo from a plant.

Jon Gottfred Andersen is Chair of the Board and co-founder of Skjld Labs and a specialist in dermatology and venereology, with his own dermatology clinic in Sandefjord. More about Jon