
From Linear Prompts to Graphs: A Practical Introduction to Graph Engineering
"Graph engineering" is this summer's big topic in the AI field, but behind the buzzword lies a simple and useful idea: workflows are made of tasks and dependencies, and most of us make our AI wait for things it doesn't need to wait for. In this article we explain what graph thinking actually means, how to find the false dependencies in your own processes, and why checker nodes and auditability matter at least as much as speed.
 Jon Gottfred AndersenChair of the Board and dermatologist
Every so often a term appears that the entire AI field starts talking about at once. This summer it is "graph engineering". A widely shared article posted on X by @Mahaximus_, approaching half a million views, captured the shift: where we used to build AI workflows as long chains of instructions, more and more people are drawing them as graphs.
As with most buzzwords, it is tempting to dismiss. But behind the hype lies an idea that is both simple and widely applicable, including for Norwegian businesses that will never call themselves "AI companies". In this article we explain what graph thinking actually means, how to find the bottlenecks in your own workflows, and why this is at least as much about quality and control as it is about speed.
What a graph actually is
Forget bar charts and curves. A graph in this context is something far simpler: a map of which tasks need to happen and what each task depends on.
The map has two building blocks. A node is a well-defined unit of work: one agent, one job, one thing in and one thing out. The smaller and more clearly defined the job, the more useful the node. An edge is a dependency between two nodes, and it only exists when one task genuinely needs the result of the other. Not "these happen one after the other", but "this one uses what the previous one produced".
That is the whole model. The rest of graph engineering is applying those two ideas consistently, at every scale.
Your workflow is already a graph
Here is what most people miss: you are already doing this, just without thinking about it. When you write a prompt like "research the topic, summarise the findings, then write a draft based on the summary", you have built a graph. A chain, where every step waits for the one before it.
The chain is the simplest graph there is, and it works. But simple is not the same as efficient. The chain is slow, because everything queues. And it is fragile, because one bad intermediate result stops everything behind it. The first move in graph engineering is therefore not learning something new. It is looking at what you already have and asking: does every step really need to wait for the previous one?
The test that exposes false dependencies
You can answer that question with an exercise that takes less than five minutes on a whiteboard:
- Write out every step of the workflow as a box.
- Draw arrows between the steps in the order they run today.
- For each arrow, ask: does data actually flow from one step into the other?
- Keep the arrows where the answer is yes. Cross out the rest. Those are false dependencies.
- Anything left without an incoming arrow can start immediately and run in parallel.
Take a monthly report as an example. Figures come from the accounting system, project status from the project tool, and customer activity from the CRM, before everything is combined into one report. In practice this is usually done in sequence, yet none of the three retrieval steps needs the others. Run them at the same time and the wait equals the slowest of them, not the sum of all three. Most people who map out one of their own workflows this way find two or three false dependencies on the first attempt. Each one is waiting time the business is giving away for free.
The diamond: the pattern that keeps showing up
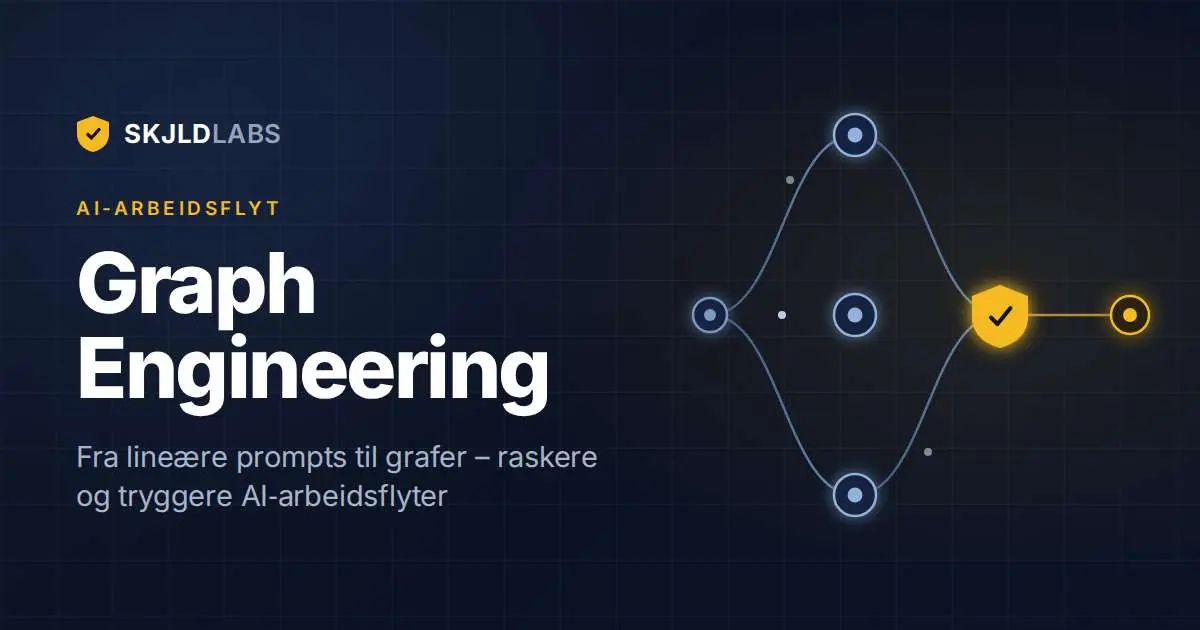
Once you start removing false dependencies, one pattern appears more often than any other. One node fans out into several parallel nodes, which all feed into a final node that pulls the results together. Draw it and it looks like a diamond.
The monthly report above is a diamond: the gathering happens in parallel, the synthesis is the convergence point. You will find the same shape in research, tender work, code review and market analysis, anywhere the form is "gather from several sources, combine at the end". The pattern has two rules: the parallel nodes must be genuinely independent of each other, and the convergence node must actually need all of their results. Get both right, and the diamond is the fastest shape a workflow can take.
Where graphs fail quietly
Parallelism has a downside, and it is easy to miss. When three nodes run at the same time and one of them returns garbage, such as a hallucination, an empty result, a misread file, the error flows straight into the synthesis alongside the good results. The convergence node does not know one of its inputs is bad. It combines everything and delivers a confident answer built on flawed material. The structure that made you fast also removed the natural checkpoints where you would have caught the problem.
The fix is a checker node: a node that sits between the parallel layer and the convergence point, with one job only: evaluating whether each result is usable before it moves on. Empty answers, contradictory findings, off-topic results and format errors should be flagged, retried or discarded before they poison the next step.
For us at Skjld Labs, this is the most important point in the entire model. A graph without checker nodes is a graph that assumes everything upstream worked, and that assumption fails more often than you would expect. Quality assurance has to be part of the architecture, not something a human does manually afterwards when there happens to be time.
Static or dynamic, and why control beats flexibility
A static graph is defined up front: you know exactly which nodes run, in what order, and why. It is fast, predictable and, crucially, auditable. A dynamic graph builds itself as it runs: a node finishes, looks at its result and decides what happens next. That is powerful when the scope of the work only becomes clear along the way, but harder to debug and audit, because the structure that actually ran is not the one you drew.
For Norwegian businesses, auditability is rarely optional. If AI workflows are used in processes that touch customers, employees or finances, you must be able to document what ran and why, both for internal control and for regulation such as GDPR and the EU AI Act. Our advice is therefore simple: always start static. Only move to dynamic graphs when you hit a wall the static version cannot handle, and never in processes that require a full audit trail. Most workflows that "feel" dynamic really just need a better-designed static graph.
What this means for your business
The beauty of graph thinking is that you do not need to build anything to benefit from it. Simply mapping out an existing process and crossing out the false dependencies often pays off within the week, regardless of which tools you use.
At the same time, the tooling has matured quickly. Modern agent platforms let you describe nodes and dependencies directly and work out for themselves what can run in parallel. That includes Claude, which the article in question is built around. You describe the graph. The platform handles the execution order. That makes the step from whiteboard sketch to running workflow lower than ever.
At Skjld Labs we use this approach when building AI solutions for our clients. Concretely, we help businesses:
- map existing workflows and identify the steps that can genuinely be parallelised
- design graphs with checker nodes, so speed never comes at the cost of quality
- choose the right balance between static and dynamic graphs based on governance and traceability requirements
- implement the solutions securely, with access control and logging that stands up to audit
Want to see what this means in practice?
Do you have a workflow you suspect is full of false dependencies? Get in touch for a no-obligation chat. We will map it out together and show you where the time actually goes.